ストキャスティクスRSIはRSIの値をストキャスティクス計算式に押し込んだグラフとなります。ストキャスティクスやRSIは価格に対する高値低値の割合をベースに計算していますが、RSIの値をストキャスティクスとしてグラフ化することによって、相場の勢いの変化をみるできます。トレンド時の押し目狙いなどに効果を発揮します。また、バイナリオプションでのハイロー選択の指標にも有効そうです。
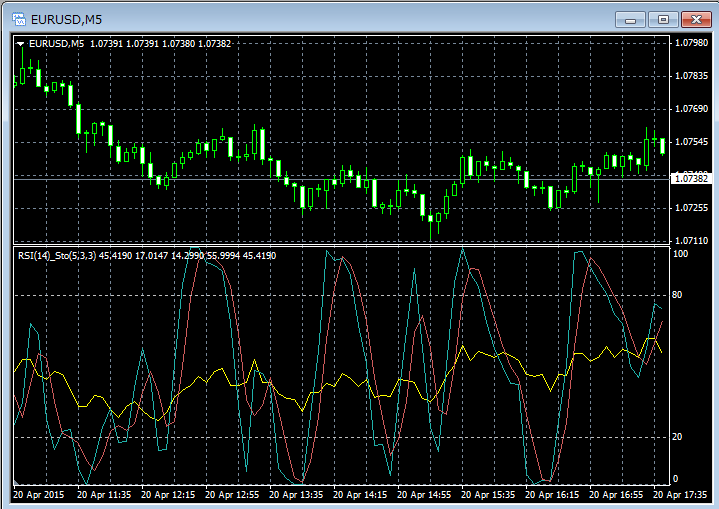
画像のように小さな値幅でだらだらと一方向に動き続けるような相場ではダミーのシグナルが発生していますが、前回ストキャス値がどこまで行っているかを見ることにより手を出すべきかどうかを判断できます。
コードはMT4についていたStochastic.mq4を改造する形で作成しました。
RSIの値とStochRSIのグラフを描画するインジケータです。
//------------------------------------------------------------------
// ストキャスティクス RSI オシレーター

#property copyright "Copyright 2015,  Daisuke"
#property link      "http://mt4program.blogspot.jp/"
#property version   "1.00"
#property strict

#property indicator_separate_window
#property indicator_minimum    0
#property indicator_maximum    100
#property indicator_buffers    5

#property indicator_label1  "RSI"
#property indicator_type1   DRAW_LINE
#property indicator_color1  clrYellow
#property indicator_style1  STYLE_SOLID
#property indicator_width1  1

#property indicator_label2  "main"
#property indicator_type2   DRAW_LINE
#property indicator_color2  clrLightSeaGreen
#property indicator_style2  STYLE_SOLID
#property indicator_width2  1

#property indicator_label3  "signal"
#property indicator_type3   DRAW_LINE
#property indicator_color3  clrIndianRed
#property indicator_style3  STYLE_SOLID
#property indicator_width3  1

#property indicator_type4   DRAW_NONE
#property indicator_type5   DRAW_NONE

#property indicator_level1     20.0
#property indicator_level2     80.0
#property indicator_levelcolor clrSilver
#property indicator_levelstyle STYLE_DOT
//--- input parameters
input int InpKPeriod = 5; // K Period
input int InpDPeriod = 3; // D Period
input int InpSlowing = 3; // Slowing

// RSI 期間
input int RSIPeriod = 14;
// RSI 適用価格
input ENUM_APPLIED_PRICE RSIPrice = PRICE_CLOSE;


//--- buffers
double ExtMainBuffer[];
double ExtSignalBuffer[];
double ExtHighesBuffer[];
double ExtLowesBuffer[];
double rsiBuffer[];

//---
int draw_begin1 = 0;
int draw_begin2 = 0;

//------------------------------------------------------------------
//初期化
int OnInit()
{
string short_name;

SetIndexBuffer(0, rsiBuffer);
SetIndexBuffer(1, ExtMainBuffer);
SetIndexBuffer(2, ExtSignalBuffer);
SetIndexBuffer(3, ExtHighesBuffer);
SetIndexBuffer(4, ExtLowesBuffer);
//--- indicator lines
//--- name for DataWindow and indicator subwindow label

short_name = "RSI(" + IntegerToString(RSIPeriod) + ")_Sto(" +
IntegerToString(InpKPeriod) + "," + IntegerToString(InpDPeriod) + "," + IntegerToString(InpSlowing) + ")";
IndicatorShortName(short_name);

draw_begin1 = InpKPeriod + InpSlowing;
draw_begin2 = draw_begin1 + InpDPeriod;
SetIndexDrawBegin(0, RSIPeriod);
SetIndexDrawBegin(1, draw_begin1);
SetIndexDrawBegin(2, draw_begin2);

return(INIT_SUCCEEDED);
}

//------------------------------------------------------------------
//計算イベント
int OnCalculate(const int rates_total,          //各レート要素数
const int prev_calculated,      //計算済み要素数
const datetime &time[],         //要素ごとの時間配列
const double &open[],           //オープン価格配列
const double &high[],           //高値配列
const double &low[],            //安値配列
const double &close[],          //クローズ価格配列
const long &tick_volume[],      //ティック数(要素の更新回数)
const long &volume[],           //実ボリューム(?)
const int &spread[])            //スプレット
{
int    i, k, pos;
//--- check for bars count
if (rates_total <= InpKPeriod + InpDPeriod + InpSlowing)
return(0);
//--- counting from 0 to rates_total
ArraySetAsSeries(ExtMainBuffer, false);
ArraySetAsSeries(ExtSignalBuffer, false);
ArraySetAsSeries(ExtHighesBuffer, false);
ArraySetAsSeries(ExtLowesBuffer, false);
ArraySetAsSeries(rsiBuffer, false);
//---
pos = InpKPeriod - 1;
if (pos + 1 < prev_calculated)
pos = prev_calculated - 2;
else
{
for (i = 0; i < pos; i++)
{
ExtLowesBuffer[i] = 0.0;
ExtHighesBuffer[i] = 0.0;
rsiBuffer[i] = 0;
}
}
//--- calculate HighesBuffer[] and ExtHighesBuffer[]
for (i = pos; i < rates_total && !IsStopped(); i++)
{
rsiBuffer[i] = iRSI(Symbol(), 0, RSIPeriod, RSIPrice, rates_total - i - 1);

double dmin = 1000000.0;
double dmax = -1000000.0;
for (k = i - InpKPeriod + 1; k <= i; k++)
{
if (dmin>rsiBuffer[k]) dmin = rsiBuffer[k];
if (dmax < rsiBuffer[k]) dmax = rsiBuffer[k];
}
ExtLowesBuffer[i] = dmin;
ExtHighesBuffer[i] = dmax;
}
//--- %K line
pos = InpKPeriod - 1 + InpSlowing - 1;
if (pos + 1 < prev_calculated)
pos = prev_calculated - 2;
else
{
for (i = 0; i < pos; i++)
ExtMainBuffer[i] = 0.0;
}
//--- main cycle
for (i = pos; i < rates_total && !IsStopped(); i++)
{
double sumlow = 0.0;
double sumhigh = 0.0;
for (k = (i - InpSlowing + 1); k <= i; k++)
{
sumlow += (rsiBuffer[k] - ExtLowesBuffer[k]);
sumhigh += (ExtHighesBuffer[k] - ExtLowesBuffer[k]);
}
if (sumhigh == 0.0)
ExtMainBuffer[i] = 100.0;
else
ExtMainBuffer[i] = sumlow / sumhigh*100.0;
}
//--- signal
pos = InpDPeriod - 1;
if (pos + 1 < prev_calculated)
pos = prev_calculated - 2;
else
{
for (i = 0; i < pos; i++)
ExtSignalBuffer[i] = 0.0;
}
for (i = pos; i < rates_total && !IsStopped(); i++)
{
double sum = 0.0;
for (k = 0; k < InpDPeriod; k++)
sum += ExtMainBuffer[i - k];
ExtSignalBuffer[i] = sum / InpDPeriod;
}
//--- OnCalculate done. Return new prev_calculated.
return(rates_total);
}
元のコードと比較すると、ちょっとだけ、初期化処理を自分でわかりやすいようにまとめました。初期化の中で次の関数をコールしています。
SetIndexDrawBegin
void SetIndexDrawBegin(
int index, // インジケーターの番号
int begin // 開始位置
);
これは、たとえば移動平均などで、ある程度のデータがそろってからではないと、描画できないような場合、描画開始する位置をずらすという指示をしています。
計算処理の部分は、Stochastic.mq4がArraySetAsSeries関数にて、時系列配列から普通の配列に変更してから計算していたため、その流儀に合わせて作成しています。・・・っていうより、まぁストキャス計算時のhigh/low/closeの値をiRSIからの値に置き換えただけです・・・(^^;;
FX-ONとかで無料インジケータとして公開したら需要あります??? ほしい方がいらっしゃったら試してみようかな・・・。